
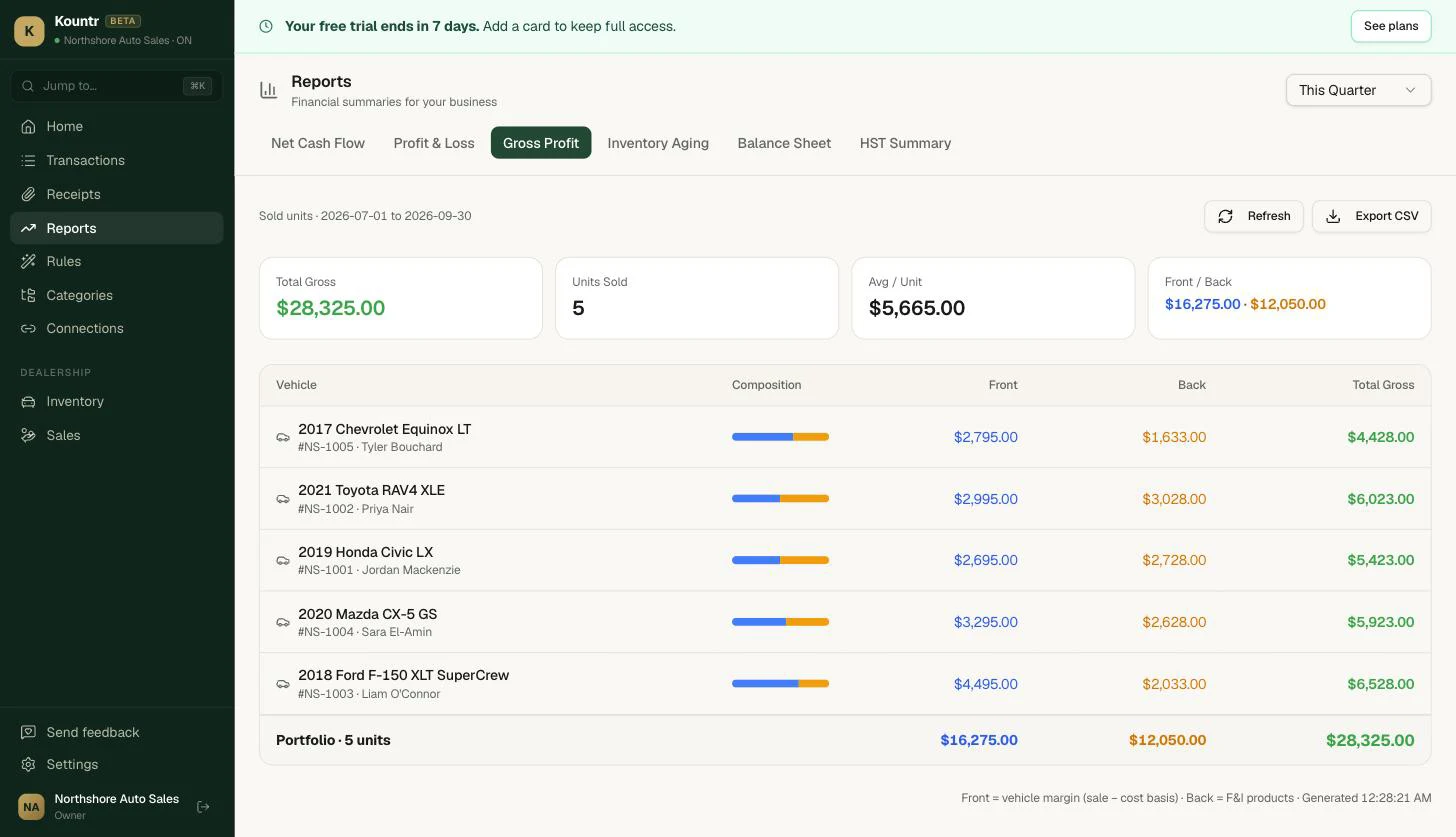
Gross profit per unit is the money you made on a vehicle after subtracting every cost that touched it — acquisition, transport, recon, and safety certification — from the sale price (front gross), plus the profit from F&I products like warranties and GAP coverage (back gross). Tracking it per VIN, in real time, is how you know whether your lot is making money before your accountant tells you 45 days later.
Why most dealers don't know their real per-unit gross
Most independent used car dealers can tell you what a vehicle sold for. Far fewer can tell you — right now, on demand — exactly what they made on it.
The accounting setup is almost always the reason. Standard bookkeeping software was not built for a business where inventory walks out the door with a serial number. Most dealers end up booking the acquisition price in one place, throwing recon invoices into a "miscellaneous" or "auto expenses" account, and trusting that month-end reconciliation will produce an honest number. It usually produces an optimistic one.
The outcome is predictable: you find out you lost money on a unit in the same week you spend money acquiring the next one.
This is not a discipline problem. It is an architecture problem. Solving it starts with understanding what per-unit gross actually measures.
Front gross and back gross: what each one measures
Per-unit profit at a dealership divides into two components. Keeping them separated — and correctly calculated — is the foundation of any real gross tracking system.
Front gross (vehicle gross profit)
Front gross is the profit on the vehicle itself:
Front gross = selling price − total cost basis
The part dealers routinely get wrong is the cost basis. It is not just the auction price. Every dollar that touched the unit from the moment it arrived belongs in that number:
- Acquisition price (auction, wholesale, trade-in, private purchase)
- Transport and delivery to the lot
- Safety certification (MTO Form 1 in Ontario; equivalent documentation in other provinces)
- Mechanical reconditioning (parts plus labour)
- Cosmetic reconditioning (detail, paint touch-up, tires, windshield)
- Auction fees, dealer-transfer fees, or transport insurance
If any of those costs sit in a general expense account rather than attached to the VIN, your front gross is overstated. You think you made $3,000. You made $2,200. The difference already happened — you just can't see it yet.
Back gross (F&I profit)
Back gross is the profit from products sold in the finance and insurance office after the vehicle deal is structured. Common sources:
- Extended warranties and vehicle service contracts
- GAP (Guaranteed Asset Protection) insurance
- Tire and wheel protection plans
- Aftermarket products: paint protection film, tint, interior coatings
Back gross does not appear in the vehicle sale transaction. It lives in a separate deal layer, which is why dealers who track only front gross are leaving a material piece of per-unit economics invisible.
Industry data from Haig Partners puts this in context: publicly traded dealership groups averaged $1,668 in front gross per used vehicle retailed in Q2 2025, while F&I generated approximately $2,515 per unit in the same period. That means the back gross exceeded the front gross at the large-group level. Independent dealers run different numbers, but the structural point is identical: back gross is not a rounding error.
Worked example: one deal, all the way through
The table below uses a 2020 Honda Civic as an illustrative example. Numbers are realistic for an independent Ontario dealer but are for illustration only — your own costs will vary by market, unit condition, and F&I product mix.
Vehicle cost basis
| Line item | Amount (CAD, sample) |
|---|---|
| Acquisition price (auction) | $14,500 |
| Transport to lot | $275 |
| Safety certification (MTO + labour) | $190 |
| Mechanical recon (brake pads, fluid service) | $610 |
| Detail and cosmetic | $240 |
| Total cost basis | $15,815 |
| Retail selling price | $18,500 |
| Front gross | $2,685 |
F&I products (back gross)
| Product | Sold for | Dealer cost | Back gross |
|---|---|---|---|
| Extended warranty | $1,800 | $1,100 | $700 |
| GAP insurance | $500 | $200 | $300 |
| Total F&I | $2,300 | $1,300 | $1,000 |
Per-unit summary
| Front gross | $2,685 |
| Back gross | $1,000 |
| Total gross per unit | $3,685 |
All-in gross margin on selling price: 19.9%.
Now here is the critical number: if the $850 in recon costs had been booked to a general "auto repairs" expense account instead of the VIN, the dealer's reported front gross would have shown $3,535 — overstated by 32%. The deal would look like a strong winner. The reality was a solid but ordinary result.
Multiply that misstatement across 10 or 20 units per month and you are pricing trade-ins, negotiating discounts, and making stocking decisions on front gross numbers that do not exist.
How recon costs quietly erode your front gross
Recon is the main source of inflated front gross across independent lots, and the pattern is consistent.
A vehicle arrives from auction. The shop writes up the work order. Parts hit "auto parts expense." Labour hits "sublet repairs" or "service costs." The detail invoice goes to "cleaning." None of it attaches to the VIN.
Three weeks later the car sells. The front gross calculation uses only the acquisition price as cost. Everything else has already been flushed through the income statement as a period expense. The per-unit gross looks strong. The actual economics are materially different.
The structural fix is straightforward: every cost incurred while a vehicle is in inventory — from arrival day to sale day — must attach to a VIN-level cost basis, not to a department expense account. This is what "VIN-level accounting" means in practice.
There is a Canadian tax dimension here as well. In HST provinces, reconditioning parts and labour carry HST that is recoverable as an input tax credit (ITC). But the ITC recovery only works if the expense is tracked with correct HST coding at the line-item level. Recon costs buried in "miscellaneous" often mean missed ITCs — effectively paying HST you were entitled to recover.
Inventory aging: the holding cost that compounds silently
Per-unit gross does not stay flat while a vehicle sits unsold. Every additional day in inventory applies pressure.
The most visible cost is floor plan interest for dealers who carry financing — but even cash-funded dealers face the opportunity cost of capital tied up in a depreciating asset. A unit that sat for 91 days before selling at the same front gross number as a unit that sold in 18 days is not the same deal. The 91-day unit consumed capital and management attention for 73 more days.
Most dealers manage aging with informal buckets. A workable framework:
| Aging bucket | What it means | Typical action |
|---|---|---|
| 0–30 days | Healthy. Market price and cost basis are aligned. | None; monitor. |
| 31–60 days | Watch. Buyer interest may be softening. | Consider price adjustment. |
| 61–90 days | Action required. Margin is compressing. | Reprice or evaluate wholesale. |
| 90+ days | Every additional day is a direct tax on gross. | Immediate price action or wholesale exit. |
A dealer who tracks per-unit gross without also tracking days-in-inventory is looking at a snapshot without context. The gross on a 90-day unit and the gross on a 20-day unit are not equivalent even when the ledger says they are — the 90-day unit cost you more to hold and probably sold at a discount to move it.
Accounting software for Canadian car dealerships should show both numbers together — cost basis and days in inventory, per VIN — without a month-end export to a spreadsheet.
Common mistakes with per-unit gross tracking
- Expensing recon to department accounts instead of the vehicle. This is the most frequent source of overstated front gross. Recon flows to cost basis until the unit sells, then to COGS at the point of sale. It does not belong in a period expense account while the car is still on the lot.
- Tracking front gross only. F&I income is real margin. Dealers who do not separate back gross from front gross cannot identify which products are contributing, which deals are structurally weak, or where F&I income is being left on the table.
- Running per-unit analysis at month-end only. If you cannot pull a cost-basis figure on a live deal, you are pricing trade-ins and negotiating discounts without the number that matters most. Real-time cost visibility changes how you close.
- Using a generic chart of accounts. A standard bookkeeping setup has no accounts for Vehicle Sales, Trade-in Revenue, F&I Products, or MTO Expense. Dealers who run on a generic chart spend time on reclassification that should be going to running the lot.
- Ignoring aging until it becomes a problem. Dealers who review aging weekly can act on pricing before a unit becomes a problem. Dealers who check at month-end are reacting to stale metal that has already cost them gross.
- Not reconciling HST on recon costs. Recoverable HST on parts and labour adds up across a full month's recon activity. If it is not tracked at the VIN level with correct coding, you are likely leaving input tax credits unclaimed.
What your accounting setup needs to handle
You do not need a full dealer management system (DMS) to track per-unit gross properly. But you do need an accounting tool that understands:
- Each vehicle is an inventory item with its own cost bucket, not a line in a general expense account.
- Costs accumulate against that bucket from acquisition through to sale.
- The sale transaction closes the cost bucket and calculates front gross automatically.
- F&I income is tracked as a separate back-gross figure linked to the same deal.
- Inventory aging is visible in real time without exporting to a spreadsheet.
- The chart of accounts is built for a dealership, not a generic small business.
This is not a workflow standard bookkeeping software handles without material workarounds. Kountr is accounting software for Canadian car dealerships that sits alongside your existing DMS — not replacing it — and handles this natively: VIN-level cost basis, front and back gross per deal, a dealer chart of accounts (Vehicle Sales, Trade-in Revenue, F&I Products, Service & Parts, MTO Expense), inventory aging buckets, Plaid bank sync, and a live Canadian HST report. The "Start a deal" workflow attaches every recon invoice and transport bill to the VIN before the car sells, so when it does sell, the gross is already there.
For more detail on why generic bookkeeping software falls short here, see our breakdown of where QuickBooks ends for car dealerships.
Ready to track front gross and back gross at the VIN level — with inventory aging, a Canadian chart of accounts, and an HST report built in? See how Kountr's accounting software for Canadian car dealerships works alongside your DMS.
Quick answers
What is a good gross profit per unit for a used car dealer in Canada?+
Benchmarks vary by vehicle mix and market. Publicly traded dealer groups averaged $1,668 in front gross per used unit in Q2 2025 (Haig Partners). Independent Canadian dealers typically run tighter overhead but lower volumes. Net profit per unit — after all operating expenses — tends to land between $500 and $1,500 depending on recon costs, lot velocity, and back gross capture.
What is the difference between front gross and back gross?+
Front gross is the profit from the vehicle sale itself: selling price minus total cost basis, which includes acquisition, all recon, transport, and certification costs. Back gross is the profit from F&I products sold in the deal — extended warranties, GAP insurance, and other aftermarket add-ons. Combined, they give you total gross per unit.
How do recon costs affect gross profit per unit?+
Recon costs increase your cost basis, which reduces front gross directly. A $14,500 acquisition with $850 in recon has a cost basis of $15,350, not $14,500. Every dollar of recon not attached to the VIN overstates front gross and gives you a false read on per-unit profitability.
Why can't I just use QuickBooks to track gross profit per unit?+
QuickBooks does not treat vehicles as VIN-level inventory items. Recon costs, transport, and certification fees must be manually coded to a per-vehicle cost account — a consistent discipline that most small dealer operations cannot maintain reliably. The result is that many dealers end up with front gross figures that look healthy but do not reflect actual per-unit economics.
Does HST affect gross profit calculations for Canadian dealers?+
HST affects your cost basis and ITC recovery, not the gross formula itself. Parts and labour for reconditioning carry HST that is recoverable as an input tax credit — but only if the expense is tracked with correct HST coding. Recon costs coded to a generic expense account often mean unclaimed ITCs, which raises your effective recon cost and depresses your actual front gross.